


PERT Chart: Definition, Formula, Examples, and How to Make One
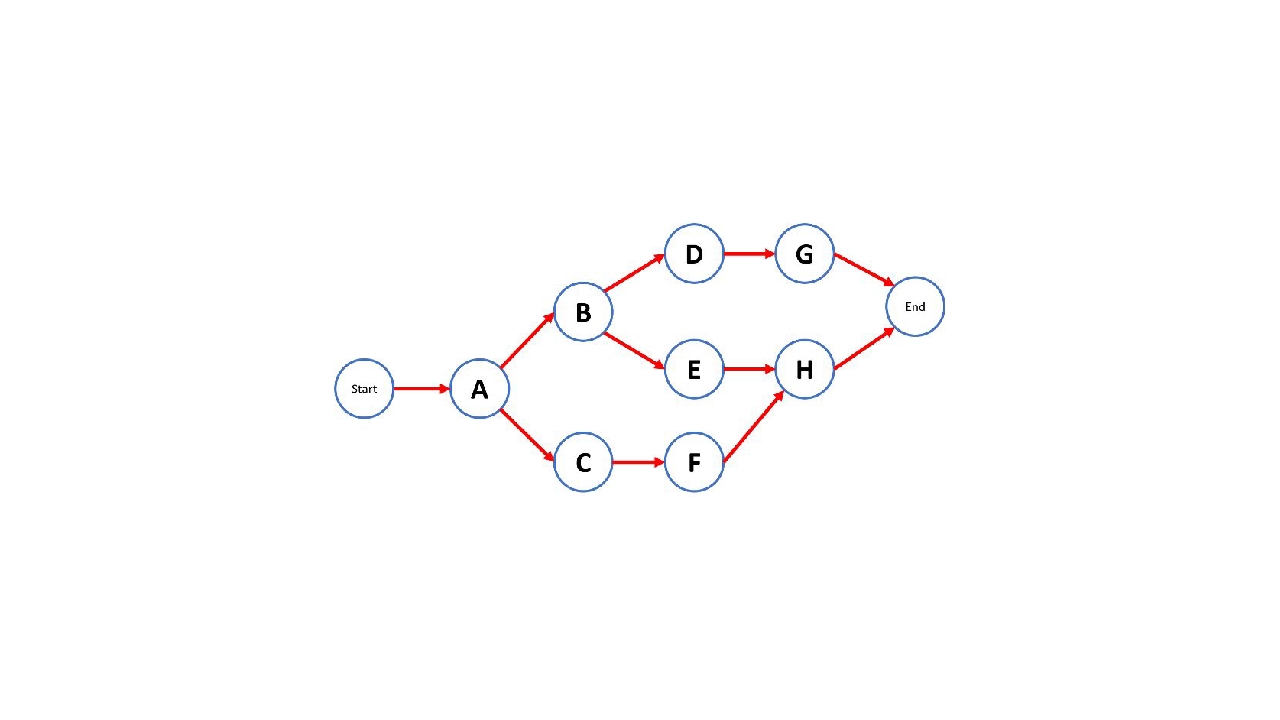
Project timelines are difficult to predict when tasks depend on one another and their durations are uncertain. A delay in one activity can affect the entire schedule, making it harder to set realistic deadlines and allocate resources.
A PERT chart helps project managers map task dependencies and estimate completion times using optimistic, most likely, and pessimistic duration estimates. In this guide, you’ll learn how PERT charts work, how to calculate expected task durations, and how to create a chart for your project.
What Is a PERT Chart?
A PERT chart (Program Evaluation and Review Technique chart) is a project planning diagram that maps activities, dependencies, and the sequence and phases of work needed to complete a project. It helps project managers estimate completion times when task durations are uncertain.
A PERT chart typically uses nodes and connecting arrows to show how activities relate to one another. By estimating how long each task might take and identifying dependencies, teams can forecast the overall project timeline and spot activities that could delay delivery.
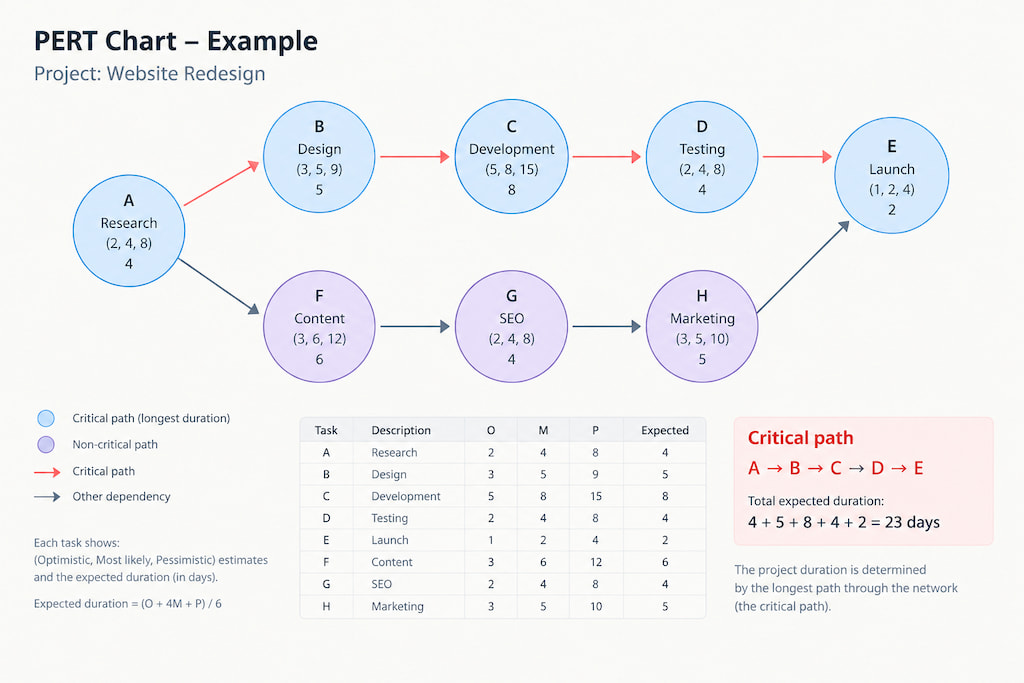
PERT charts are particularly useful for complex projects where the sequence of work matters and reliable duration estimates are difficult to obtain, such as product development, software implementation, and research projects.
How Does a PERT Chart Work?
A PERT chart represents project activities as a network. Each activity has an estimated duration, and connections between activities show which tasks must be completed before others can begin.
The method relies on three time estimates for each activity:
- Optimistic (O): The shortest reasonable time required to complete the task under favorable conditions.
- Most likely (M): The expected duration under normal working conditions.
- Pessimistic (P): The longest reasonable duration, accounting for potential delays or complications.
These estimates help teams account for uncertainty instead of planning around a single potentially unreliable number.
For example, a software team estimating a feature release might expect development to take five days, but allow three days in an optimistic scenario and nine in a pessimistic one. The PERT formula combines these estimates into a weighted expected duration.
The chart also shows which activities can happen in parallel and which depend on earlier work. This makes it easier to identify bottlenecks, estimate the project’s completion date, and understand how delays in one activity could affect the rest of the schedule.
PERT Chart Formula: How to Estimate Project Duration
The PERT formula calculates a weighted expected duration for an activity using its optimistic, most likely, and pessimistic estimates.
PERT expected time formula:
[
T_E = \frac{O + 4M + P}{6}
]
Where:
- (T_E) = expected task duration
- (O) = optimistic estimate
- (M) = most likely estimate
- (P) = pessimistic estimate
The most likely estimate receives four times the weight of either alternative because it represents the expected duration under normal conditions.
PERT formula example
Suppose a team estimates that testing a new software feature will take:
- Optimistic estimate: 3 days
- Most likely estimate: 5 days
- Pessimistic estimate: 9 days
Using the formula:
[
T_E = \frac{3 + (4 \times 5) + 9}{6}
= \frac{32}{6}
\approx 5.33 \text{ days}
]
The expected duration is approximately 5.33 days, rather than simply choosing the most likely estimate of five days.
Repeat this calculation for each activity in the project. The resulting estimates can then be used to analyze task sequences and calculate the expected project duration.
PERT variance formula
For projects that need a closer look at schedule uncertainty, PERT also provides a simple estimate of activity variance:
[
\sigma^2 = \left(\frac{P-O}{6}\right)^2
]
Here, (P) is the pessimistic estimate and (O) is the optimistic estimate. A larger variance indicates a wider range between the two estimates and, therefore, greater uncertainty.
This measure can help project managers identify activities that deserve closer attention. However, it is based on assumptions about the distribution of task durations, so it should be treated as an estimate rather than a precise prediction.
PERT Chart Example
Consider a team preparing to launch a new website. The project includes designing the interface, developing the site, writing content, testing functionality, and publishing the finished product. Some tasks can happen simultaneously, while others depend on earlier work.
The team estimates each activity using three-point estimates and calculates its expected duration with the PERT formula.
| Activity | Depends on | Optimistic (days) | Most likely (days) | Pessimistic (days) | Expected time (days) |
|---|---|---|---|---|---|
| A. Plan project | — | 1 | 2 | 3 | 2 |
| B. Design interface | A | 2 | 4 | 6 | 4 |
| C. Write website content | A | 2 | 3 | 4 | 3 |
| D. Develop website | B | 4 | 6 | 11 | 6.5 |
| E. Test website | C, D | 1 | 2 | 3 | 2 |
| F. Launch website | E | 1 | 1 | 2 | 1.17 |
The dependencies form this sequence:
- Project planning (A) must finish before design (B) and content writing (C) begin.
- Development (D) depends on the interface design, while content writing can proceed in parallel.
- Testing (E) starts after both development and content writing are complete.
- Launch (F) follows testing.
The longest path is A → B → D → E → F, with an expected duration of approximately 15.67 days. The parallel content-writing path takes less time, so it doesn’t determine the project’s overall duration in this example.
This illustrates how a PERT chart helps teams estimate the project timeline based on dependencies rather than simply adding up every task’s duration.
How to Make a PERT Chart
Creating a PERT chart involves breaking a project into activities, estimating their durations, and mapping the dependencies between them.
1. Define the project scope
Start by identifying the project’s goal, deliverables, and completion criteria. A clear project scope helps you decide which activities belong in the chart and prevents unrelated work from complicating the schedule.
2. Break the project into activities
Divide the deliverable into manageable tasks. Each activity should have a clear outcome and a duration that can be estimated. Avoid making tasks so broad that their timelines are difficult to predict, or so small that the diagram becomes unreadable.
3. Identify task dependencies
Determine which activities must finish before others can begin. Also identify tasks that can run in parallel. Mapping these relationships establishes the network structure and reveals where a delay could affect subsequent work.
4. Estimate task durations
For each activity, record optimistic, most likely, and pessimistic estimates. Use historical project data and input from the people performing the work whenever possible. Document major assumptions so the estimates can be reviewed later.
5. Calculate expected durations
Apply the PERT formula to each activity:
[
T_E = \frac{O + 4M + P}{6}
]
Use the resulting expected durations to estimate the length of each path through the network.
6. Draw the PERT network
Represent activities and dependencies in a network diagram. Connect tasks in their required order, showing parallel activities where applicable. Depending on the notation, nodes may represent activities or milestones, so keep the chosen convention consistent throughout the chart.
7. Identify the critical path
Calculate the duration of each complete path through the network. The longest path is the critical path: any delay to an activity on this path can delay the project unless the schedule is adjusted. This step helps teams prioritize tasks that have the greatest impact on the completion date.
8. Review and update the chart
Validate the dependencies and estimates with the team. As work progresses, update the chart when actual durations, project scope, or assumptions change. A PERT chart is most useful when it reflects the project’s current conditions rather than the original plan alone.
How to Use a PERT Chart for Project Planning
Once the chart is built, use it to make scheduling decisions and manage uncertainty throughout the project.
- Forecast completion dates. Use expected task durations and dependencies to estimate how long the project may take.
- Prioritize critical activities. Monitor tasks on the critical path because delays to these activities can affect the final deadline.
- Coordinate parallel work. Identify activities that can proceed simultaneously and plan handoffs between teams.
- Assess schedule risks. Compare optimistic and pessimistic estimates to spot tasks with substantial uncertainty.
- Evaluate alternatives. Explore whether changing task sequences or starting eligible activities earlier could shorten the timeline.
- Communicate assumptions. Share estimates and dependencies with stakeholders so they understand what the projected deadline depends on.
- Refine future estimates. Compare planned durations with actual completion times to improve forecasting on later projects.
A PERT chart supports planning, but it doesn’t automatically account for every constraint. Resource availability, competing priorities, scope changes, and approval delays may also affect the schedule, so teams should consider these factors alongside the diagram.
PERT Chart vs. Gantt Chart
PERT charts and Gantt charts both help teams plan projects, but they emphasize different aspects of scheduling. A PERT chart focuses on task dependencies and estimating timelines under uncertainty, while a Gantt chart displays activities along a calendar timeline.
| Feature | PERT chart | Gantt chart |
|---|---|---|
| Main purpose | Analyze dependencies and estimate project duration | Schedule and track work over time |
| Visual format | Network diagram | Horizontal timeline with task bars |
| Task dependencies | Highlights relationships between activities | Shows dependencies alongside scheduled tasks |
| Duration estimates | Can use optimistic, most likely, and pessimistic estimates | Typically displays planned start dates and durations |
| Progress tracking | Less suited to day-to-day tracking on its own | Makes planned versus actual progress easier to visualize |
| Best for | Complex projects with uncertain durations | Managing schedules, deadlines, assignments, and progress |
The two methods can complement each other. Use a PERT chart to analyze dependencies and estimate the project timeline, then use a Gantt chart to assign dates, coordinate work, and monitor progress.
PERT Chart vs. Critical Path Method (CPM)
PERT and the critical path method (CPM) are related project scheduling techniques. Both map activity dependencies and help determine the minimum time required to complete a project, assuming the activity durations and dependencies are accurate.
The main difference is how they approach duration estimates.
- PERT uses optimistic, most likely, and pessimistic estimates to calculate an expected activity duration. It’s useful when task durations are uncertain.
- CPM typically uses a single duration estimate for each activity and identifies the critical path to help manage the schedule.
| Feature | PERT | CPM |
|---|---|---|
| Duration estimates | Three estimates per activity | Typically one estimate per activity |
| Primary focus | Planning under duration uncertainty | Scheduling and critical-path management |
| Typical application | Research, development, and unfamiliar projects | Construction, production, and projects with more predictable activities |
| Critical path | Can be calculated from expected durations | Central to the method |
These distinctions aren’t absolute. PERT can identify a critical path, and CPM can be applied to projects with some uncertainty. Teams can combine the approaches by using PERT estimates as duration inputs for critical-path analysis.
FAQs
PERT stands for Program Evaluation and Review Technique. It’s a project scheduling method that uses a network diagram and three-point duration estimates to help plan activities and forecast completion times.
A PERT chart helps project managers map task dependencies, estimate project duration, and identify the sequence of activities that determines the expected completion date.
The expected duration of an activity is calculated as:
[
T_E = \frac{O + 4M + P}{6}
]
Here, (O) is the optimistic estimate, (M) is the most likely estimate, and (P) is the pessimistic estimate.
Calculate the expected duration of each activity, then determine the duration of every complete path through the network. The path with the longest total duration is the critical path. Delays to activities on this path can delay the overall project unless corrective action is taken.
A PERT chart emphasizes task dependencies and duration estimates, while a Gantt chart shows activities on a calendar timeline. PERT is useful for analyzing project structure; Gantt charts are useful for scheduling and tracking execution.
Yes. A PERT network can show activities that proceed simultaneously when they don’t depend on one another. The next dependent activity can begin once all its required predecessor activities are complete.
Use a PERT chart when a project has complex dependencies or uncertain task durations, particularly in research, product development, and other projects where reliable estimates are difficult to establish in advance.
Conclusion
PERT charts help project managers plan around uncertainty by mapping task dependencies and calculating expected durations from three estimates. They can reveal the critical path, clarify scheduling risks, and support more realistic project timelines.
For the best results, combine realistic estimates with validated dependencies and regular updates. Pairing a PERT chart with a Gantt chart or project tracking tool can also help teams turn an initial schedule into a plan they can monitor as work progresses.

Maria
A dedicated content enthusiast with extensive experience in international teams and projects of all sizes. Maria thrives on creativity and attention to detail, fueled by a love for fantasy novels, music, classic black-and-white films, and always finding ways to make things better.